Instagram Analytics - 6 tools + 5 KPIs to measure your performance
Table of Contents
With over a billion active Instagram accounts, this social media giant is a key platform for any business or brand looking to market any products or services. But if you really want to be successful on Instagram, you need to keep track of your analytics.
Monitoring your brand’s performance on Instagram and understanding who your audience is and how they behave is essential to creating effective content, growing your customer base, and driving engagement.
In this article, we will present you with 6 excellent tools to analyze your Instagram account’s performance, and then, we will detail the 6 KPIs or key performance indicators to follow absolutely on your account.
6 great tools to analyze the performance of your Instagram account
Instagram Insights
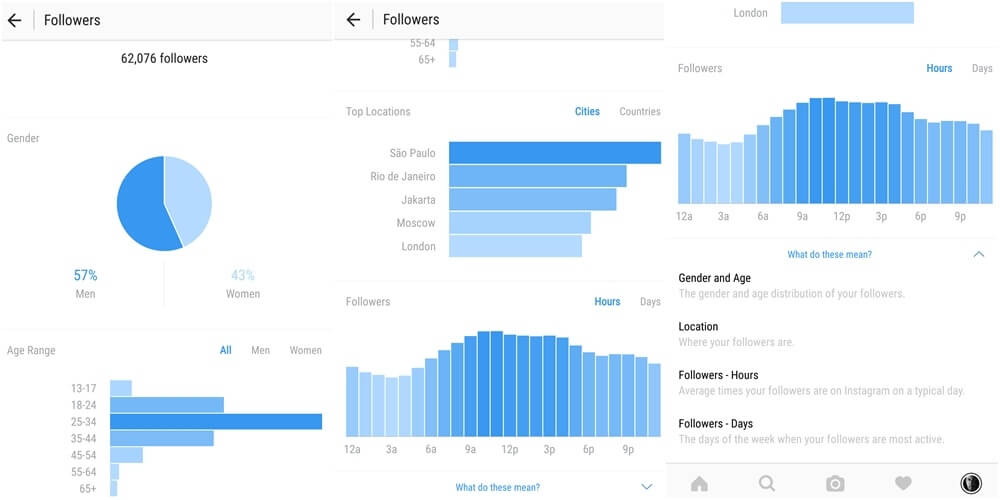
Instagram Insights is an Instagram-specific analytics tool available if you upgrade your Instagram account to Instagram Business. It’s free, and it’s a very quick and easy process that just involves connecting your Instagram account to your Facebook page. To do this, simply open your Instagram app, select Settings> Switch to Business Profile, and then follow the steps in the process. In a few clicks, it’s done! Once your Instagram account has been switched to Business mode, you will have access to your account’s statistical data. You can display information about your publications, your profile, your Stories or even your paid publications. You will also have access to complete information about your subscribers (age, location, gender etc.).
- Access information about the demographics of your audience.
- See how well the posts you’ve promoted are performing.
- Monitor the performance of your Instagram Stories.
- Available only on the mobile app
Rate
It is a completely free service.
Sendible
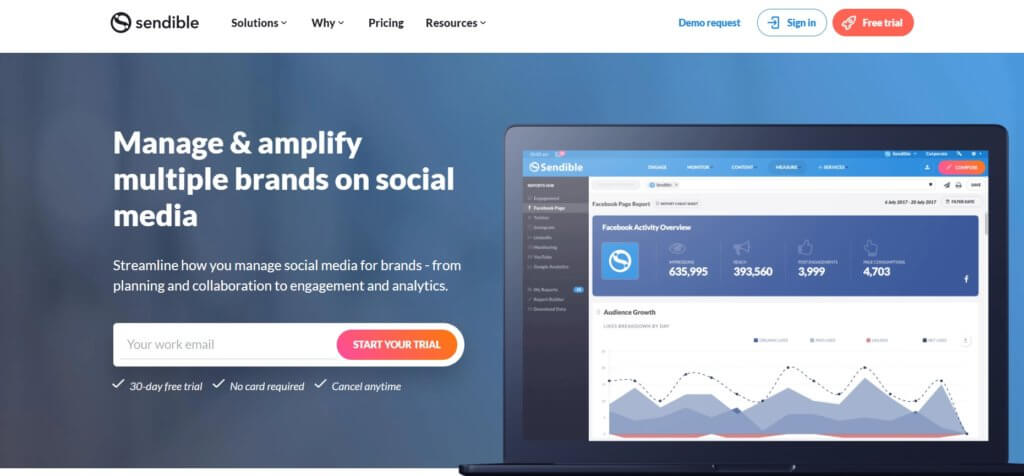
Sendible is an in-depth social media management tool, which will allow your team to manage large numbers of customers from a central dashboard. Use this solution to organize content across all the social platforms you manage, simplify publishing processes, and monitor your results. But what analytics tools does Instagram offer Sendible? Google Analytics is the foundation of Sendible and will help you understand the impact of your Instagram strategy on a website. You can track the effects of social media campaigns on the number of visitors to a site, page views, content popularity, and more. This is powerful information that will help you prove the value of your Instagram campaigns to customers. Moreover,
- Monitor your Instagram engagement.
- Track mentions of your brands across all social media channels.
- Measure your team’s response times.
- Identify the optimal times to post.
- No free plan is available.
Rate
Sendinble costs anywhere from $ 20 per month for entrepreneurs to up to $ 200 for large teams. Sendible caters to all budgets and Instagram analytics needs. You can sign up for a 30 day free trial.
SquareLovin
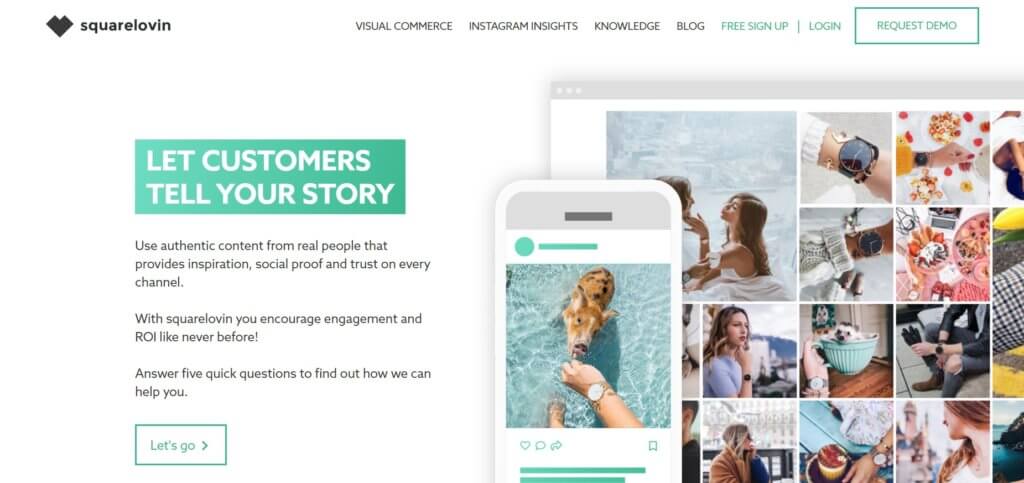
SquareLovin is a social media solution that has an efficient Instagram analytics tool. Using SquareLovin, you can gain insight into your recent posts, your follower growth, your communities’ preferences and interests, and more. SquareLovin provides many community interaction reports. This data will help you identify when your audience is active and most engaged with your content. By posting photos and images to Instagram when your key audience is online, your posts will receive higher levels of engagement and reach a larger audience. This is also the time when you need to be online, commenting, liking, and generally interacting with your community.
- Check the performance of each post.
- Track the type of media that most appeals to your Instagram audience.
- Find out which filters receive the highest levels of engagement.
- Learn more about your followers.
- Analyzes start only after the first month.
Rate
The tool is free.
Hootsuite
Hootsuite is a popular social media tool that addresses a variety of specific networking needs. Features include post-planning, content filtering, ad management, and of course, analytics tracking, to name a few. It’s important to monitor sentiment around your brand, help you understand what people think about your business, and how it changes over time. With Hootsuite, you can not only measure that sentiment, but also filter the metrics by location, language, and gender. This knowledge will allow you to deal with any negative feelings or to capitalize on the positive.
- Measure the performance of your posts, monitor hashtags, and monitor your growth over time.
- Track commonly used words and phrases in your brand’s searches.
- Export reports to prove your social ROI.
- Set alerts to instantly let you know if there’s a change in sentiment around your brand, spikes in engagement volume, or other metrics that change dramatically.
- Longer learning curve. For those who prefer simplicity, another downside is the sheer number of features Hootsuite offers.
Rate
Hootsuite offers a range of free and premium plans. So whether you are just starting to grow your Instagram account or are part of a large organization or team, Hootsuite will meet your needs.
SproutSocial
Sprout Social is a powerful solution for social media. From publishing and engagement tools to statistical analysis, Sprout Social can support any business along its social journey. Sprout Social also provides an Instagram Analytics suite, helping you analyze your data and make better Instagram-related decisions. In Sprout Social’s Instagram Analytics suite, you can easily track your latest organic campaign to understand how it’s being viewed. You can view data showing the number of impressions, audience, and clicks. With Instagram Analytics from Sprout Social, ad campaigns can be compared, and data can be tracked over defined time periods.
- Access reports on the performance of your competitors.
- View data about your Instagram profile.
- Watch for hashtags.
- Track the engagement of your posts.
- The mobile application does not include statistical analyzes
Rate
Sprout Social starts at $ 99 per month, with a 30-day free trial.
Quintly
Quintly allows you to track, compare, and optimize your social media performance, providing analytics for a range of platforms including Facebook, Twitter, YouTube, Pinterest and, of course, Instagram. You can easily monitor your brand’s performance in all areas. Quintly will allow you to perform a competitive analysis by comparing your brand to others in your industry. You can create custom groupings and compare your data with that of your competitors. This will help you understand how your brand performs and give you insight into your competitors’ successful Instagram strategies.
- Measure all relevant follower metrics.
- Analyze reactions to your Instagram content.
- Monitor the reach and impressions of all posts.
- Track the performance of your Instagram stories.
- The prices are a bit high.
Rate
Quintly offers a number of plans, with the cheapest starting at $ 100 per month. It will allow you to connect up to five social profiles, making it a suitable choice if your main focus is mostly Instagram.
The 6 KPIs or performance indicators of your Instagram
Here are the main key performance indicators that you will need to track on your Instagram account.
Your account statistics
Global engagement rate
Average overall posts: [Interactions between posts ÷ total number of subscribers (or impressions) ✕ 100]. This percentage often decreases as you gain more followers. But it’s still the best baseline to gauge how much your followers like you. Almost all analysis tools will calculate this engagement rate for your account but also per post. Since some experts think impression count is a better statistic than subscriber count, be aware that you may get a different number depending on the tools.
Growth rate of your followers
Number of subscribers gained ÷ number of previous subscribers ✕ 100 . It is true that many believe that the number of subscribers is only there to please your ego. However, no other number has a greater impact on organic reach. Monitor your monthly percentage growth and keep an eye out for peaks and valleys. It’s a great indicator of whether you’ve hit the nail on the head (or not) in your previous posts.
Referral site traffic
Since we’re ultimately here to prove ROI, it’s critical to monitor your Instagram account’s effects on your website visits. While many analytics tools will track the number of people clicking on your bio link, dig deeper into your analytics using UTM parameters. This is especially important for Instagram, as you can’t use links in regular posts. Traffic from Instagram doesn’t always seem to come from Instagram. UTM settings can capture data from anyone who copied / pasted the link into their browser, sent it to a friend, or was referred by an influencer.
Statistics of your audience
These are demographic statistics of all your subscribers by gender, location, age, and connection time. Of course, this last point is particularly useful in determining when, exactly, is the best time to post your content on Instagram.
The best hashtags
Instagram’s search feature works with hashtags, which is why they are the best way to attract new fans organically. But rather than drowning yourself in the most popular hashtags like #instagood or #love or #picoftheday, use this metric to target the niche hashtags that work best for your brand.
Statistics of your posts
Post engagement rate
Post interactions ÷ total number of followers (or impressions) ✕ 100. Engagements (likes, comments, and recordings) are absolutely essential on Instagram. Some social media experts prioritize comments over likes because they take more effort and may indicate a higher level of interest. But many tools treat them equally. If your goals are to build loyalty or nurture relationships, count your comments separately and work on increasing that particular number.
Impressions
This is the total number of times your content has been shown to Instagram users. The number of impressions generated by an article or post can indicate how (well) you are promoting your account and content. Are you choosing the right hashtags? Is your cross promotion effective? Have you considered paid posts? Keep an eye on this impression number, especially if your goal is to build awareness of your subscribers at the top of your sales funnel.
The scope
This is the total number of unique accounts that have viewed your content. Your organic reach is related to the number of followers you have, but that’s not all. It also depends on the quality of your content.
Statistics of your Instagram Stories
Engagement on your Stories
Total actions ÷ Total reach X 100. To measure engagement on your Stories, you must add the responses you received, the visits to your profile, and the different clicks. These positive interactions can tell you what you are doing right.
The number of navigation actions
Instagram Stories are one of the few places on social media where you can get negative feedback. Pay attention to how your audience uses the following settings:
- Back (they want to watch your story again)
- Before (they skip your story)
- Next Story (a Story they don’t really care about)
- Quit (they quit watching Stories)
This is great information on whether the content in your Stories is right for your audience.
Statistics of your Instagram ads
Click-through rate
Clicks ÷ Impressions x 100. This number measures the effectiveness of an advertisement in attracting attention. A low rate means you should ask yourself if your call to action is compelling enough.
Conversions
For many brands, this number is the ultimate goal. You want to sell your product, register a new lead, or get an email address. So make sure your Instagram landing page is as killer as the ad that leads to it.


